

Why is it important to understand the customer journey?
Every closed deal has a story, but most companies only have clear visibility into the final chapter. There are clear dates for when the deal began and when it was signed, but everything else is often a blur. This is especially true of longer deal cycles in the B2B space, where there are often multiple stakeholders involved throughout the process.
But being able to tell the story of a deal is crucial to understanding what worked, so that your GTM team knows what to repeat to bring more customers in. The questions that often come up around customer journeys include: How did the prospect first hear about you? What sparked their interest enough to take a meeting? Who inside their organization drove the conversation forward? Without answers to these questions, you’re left guessing about what truly influences your pipeline. Or, even worse, relying on a handful of fields in your CRM that attempt to bucket a unique journey into a single source.
Customer journey research fills in that gap. It’s about reconstructing the sequence of meaningful interactions that move a buyer from awareness to action, so you can understand not just what happened, but why it happened. When done well, it can reveal the real decision-makers, pivotal touchpoints, and unseen forces that shaped the deal into what it was. Once you have clear visibility into this, your team can double down on activities that actually work, and stop wasting time, energy, and resources on those that don’t.
In this post, we’ll break down exactly how to build a complete, data-driven picture of your customer journey, from gathering and cleansing your data to mapping every influential activity, so you can accurately depict the story of any deal.
So how do you build one?!
Make an inventory of your data
Here’s an organized inventory of where you can usually find the core data for mapping your customer journey, along with the types of details to expect from each source:
CRM
- Deal lifecycle: opportunity stage history, open/closed dates, outcomes
- Sales engagement data: logged emails, meeting invites, call notes
- Accounts & people: companies, leads, and contacts with associated context added by sales
- Campaigns: event, webinar, and content touchpoints
- Custom objects: any unique company-specific data models (e.g., product usage, contracts)
Marketing Automation
- Web activity tied to identifiable individuals (page visits, form fills)
- Marketing email activity (sends, opens, clicks)
- Campaign participation records (may overlap with CRM campaigns)
Meeting Recording Platforms
- Meeting metadata: date, time, duration, attendee lists
- Conversation transcripts or summaries
Other Systems & Signals
- Any platform that logs customer or prospect actions (e.g., chat tools, community platforms, product analytics)
- Actions can be behavioral (downloads, logins) or engagement-based (likes, shares, feedback)
Bring all the data to one place
Once you’ve identified the data points you want to use, consolidate them in a single location. Many companies opt for a data warehouse to make blending and querying easier, but you can start as simply as exporting the relevant records and creating one spreadsheet per account. The goal is to line up activities from different platforms so you can see the full sequence. For example, a prospect might click a LinkedIn ad to visit your website, register for a webinar, and later receive an email from sales. You only see the real story when web traffic, campaign activity, and email history are shown together in chronological order.
Annotate and cleanse the data
Once all your data is in one place, you’ll likely spot inconsistencies, missing fields, or unclear actions that make it harder to tell a clean story. This is where annotation and cleansing come in. At a minimum, every activity should include:
- Timestamp: The exact date and time the activity happened (date alone works if time isn’t available). This lets you accurately place events in sequence.
- Action clarity: “Event” is not that useful. Did the prospect register for the event, or attend live? Make sure you’re capturing what actually happened, and identifying significant engagement.
- Actor: Who performed the action? Was it the prospect or your internal team? Sending an email to a prospect is very different than receiving an email from one.
- Context: How did the action happen? If someone visited a webpage, did they arrive via search, a direct link, a referral, or an email campaign? If they clicked an email link, which email did they engage with?
These details transform raw activity logs into a narrative-ready dataset, albeit one that is likely to be getting unwieldy! But we’ll fix that next…
Filter down to people and periods that matter
To tell a clear, actionable story, you can’t include every action from everyone tied to an account as the real signal will disappear in the noise. Focus only on significant actions taken by members of the buying group. Identifying that group can be done in a few ways, in order of accuracy:
- Build your own buying group: Use context and activity patterns to assemble it yourself. Typically, this includes anyone who interacts directly with your sales reps, plus others who consistently appear in email threads or meetings. Usually the decision-maker is clear in any deal, and you’ll want to find the people that surround/influence them.
- Trust the CRM data: Use the contacts your sales reps have linked to opportunities as the buying group. This is the easiest method, but it’s often incomplete as busy reps often miss updating the CRM to add all the accurate buying group members.
- Include everyone in the account: This is rarely worth it. You’ll drown in excess activity and end up reporting on people who had no real influence on the deal.
With all activities neatly organized by date, you can sort them chronologically and zoom in on only the period relevant to your story. The right window depends on the question you’re trying to answer. Common examples include:
- What activated this deal? From the earliest recorded activity up to the moment a meeting was accepted.
- How did we win this deal? From the first meeting through contract signature.
- How did we earn this upsell, cross-sell, or expansion? From the prior contract signature to the subsequent one.
- How did each buying group member first hear about us? Look for the earliest engagement from each person.
For this guide, we’ll use “What activated this deal?”—the most common scenario when answering, “What should we invest more in to bring in more deals?”
Pick a moment, and look backwards
Begin at the date/time of the first accepted meeting. Who accepted the calendar invite? Who showed up to the meeting? Those people should be members of your buying group.
Then ask: how did they get there? Usually, there’s an activity immediately preceding the meeting that provides a clue. It could be a sales rep outbounding the prospect, or a call record marked as “answered / meeting booked.” It could also be a marketing interaction that led to sales follow-up.
With true inbound deals, you might see a meeting accepted without ANY rep involvement either through a web chat or a meeting booking link on your site.
Keep going backwards: what made them inclined to take the meeting? Did they interact with your team in the past? Did they consume content that made them aware of your product or service? Maybe you met months ago at a tradeshow and they remembered your brand.
Meeting transcripts can be a goldmine here, as the “how we got here” story they share often surfaces in the first few minutes.
Your end goal is to identify the handful of activities that clearly influenced the journey for members of your buying group. Include older activities if they were impactful, but lean toward excluding activity that resulted in long gaps of inactivity or low momentum.
Assemble the customer journey map
A meaningful customer journey map for a particular customer includes:
- The key stakeholders involved
- The touchpoints that made a significant influence on the customer
- A chronological timeline
- An indicator for aggregate engagement across all members of the buying group. Often this is a line chart overlay that helps viewers understand when velocity picked up/dropped off.
Examples
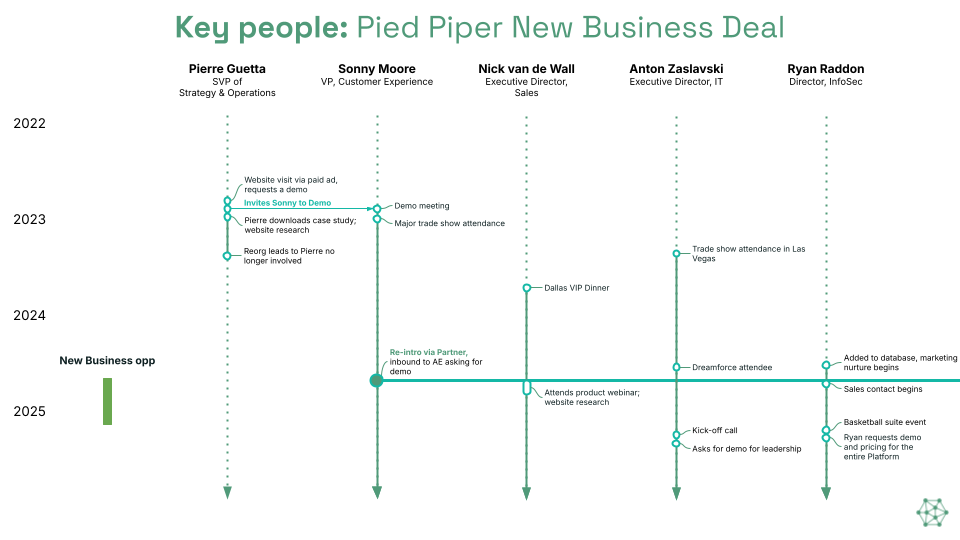
This customer journey map shows the five main members of the buying group and their engagement over time, leading up to the sales opportunity in question. It highlights the key events that built awareness among the buying group, as well as the connections between certain members. By mapping interactions chronologically, you can see not just who was involved, but how each person’s path into the deal unfolded.
There’s a clear moment when four out of five members attended the same demo meeting, represented by the horizontal line. Moments like this often signal a tipping point when interest shifts from individual curiosity to a collective evaluation. From here, the conversation typically accelerates, decision-making becomes more coordinated, and momentum builds toward a deal.

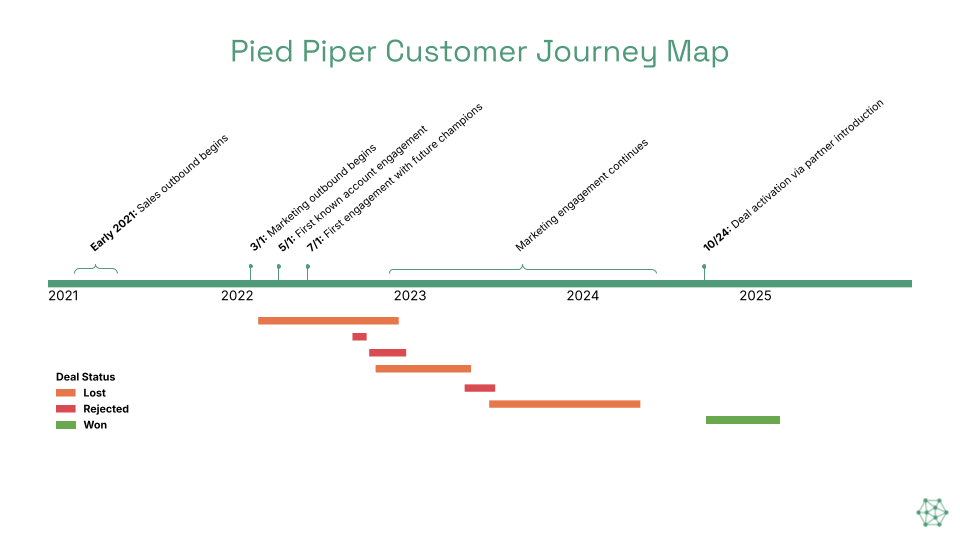
Here’s another example, this time in a horizontal format. It shows multiple attempts to close the deal before the main opportunity finally took shape in 2025. A map like this makes it clear how long a company has been working to engage an account before a meaningful opportunity emerges.
As is often the case with Account-Based Marketing (ABM) motions, those early touchpoints help build awareness, establish familiarity with your brand, and keep you top of mind so that when the right trigger appears, you’re already part of the conversation. Tracking these interactions over time highlights how persistence and multi-channel engagement can turn long-term pursuits into eventual wins.
Account Story tools can help
Forensic attribution platforms make this kind of deep journey analysis possible and Upside was built for exactly this. We pull every relevant touchpoint from your CRM, marketing automation, sales engagement, calendars, and meeting recordings into a single, unified dataset. Then we heal and enrich that data, stitching together the full account view so you can filter out the noise, zoom in on pivotal interactions, and see the real story behind a deal.
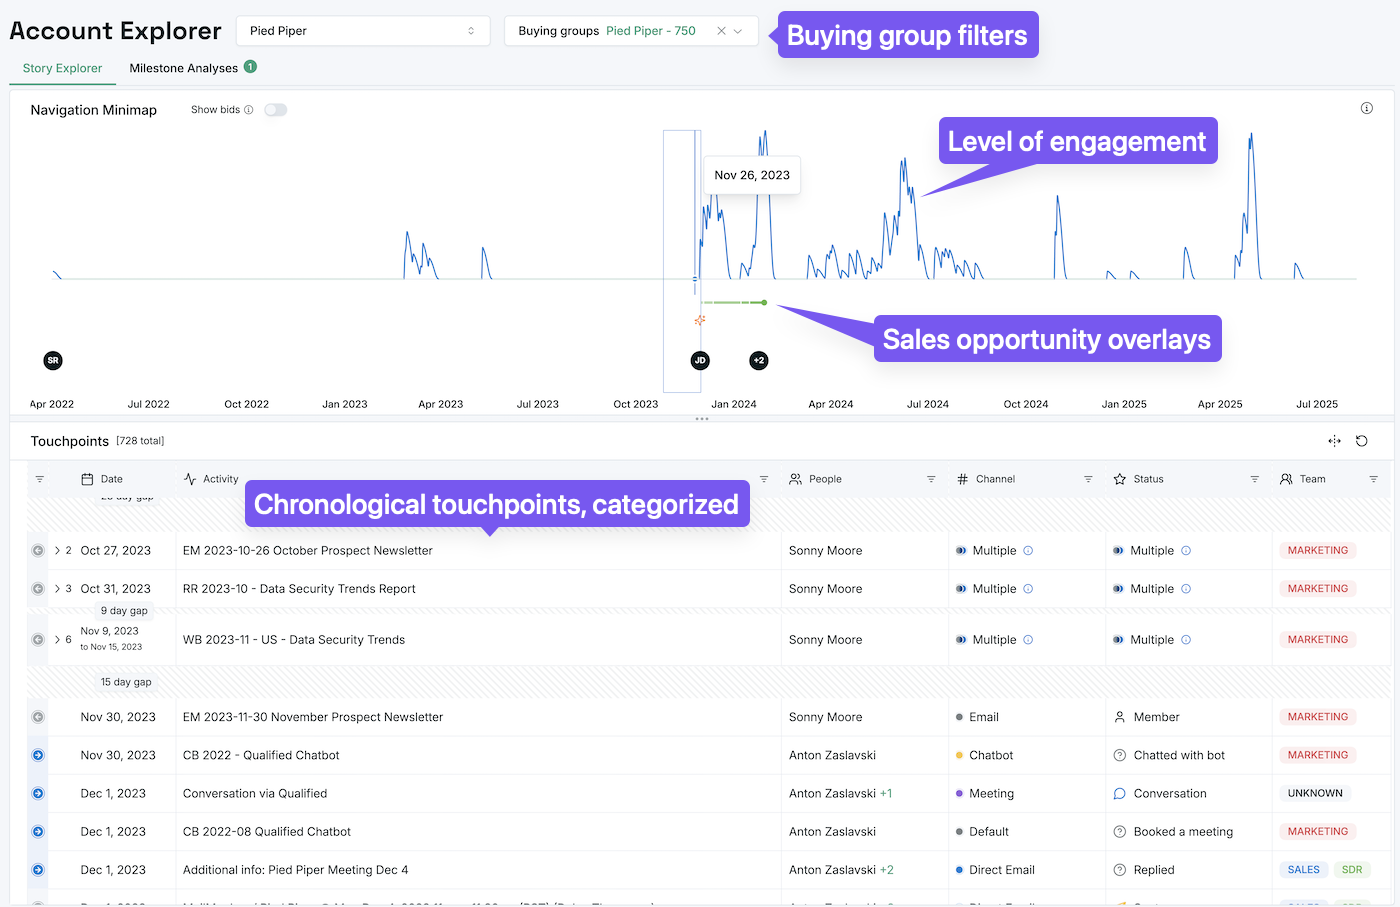
With Upside’s Account Explorer, you can scan thousands of tracked activities and instantly isolate the moments that actually mattered. If you’d like to learn more about how this works, check out this 3-minute video!
When you can see the full customer journey, you stop making decisions based on hunches and start operating with precision. Every touchpoint, from a single web visit click to a critical meeting, becomes part of a bigger picture that shows what truly moves deals forward. By connecting the dots across your GTM data, you give your team the power to focus on what works, cut out what doesn’t, and confidently repeat success.
The story of a deal is already hiding in your data, it just needs to be uncovered and told. With a clear, visual customer journey map, you can share that story in a way that drives alignment, sharpens strategy, and fuels growth.