


The “Why”
Every marketing team tracks web analytics — page views, bounce rates, conversions. But few can answer the question that truly matters: Which parts of our website actually drive revenue growth, and which types of revenue are they influencing?
You might know that your pricing page has high engagement or that your blog drives organic traffic, but can you distinguish whether those visits are fueling net-new pipeline, renewals, or upsells?
If the answer is no, you’re not alone. Most attribution systems were built for simpler GTM motions: when one buyer filled out a form, and one channel got the credit. Today, enterprise deals involve dozens of people, hundreds of touchpoints, and systems that rarely agree on what happened or when. The result? Analytics that track clicks, not outcomes.
The only way to truly understand what drives revenue is to reconstruct the true sequence of buyer interactions across systems and across teams to connect those patterns back to opportunity types. That’s what Upside calls Forensic Revenue Intelligence: rebuilding a clean, trustworthy picture of what happened so you can finally see what worked.
Here’s how you can approximate that process, and why companies now use Upside to automate it at scale.
1. Take Inventory of Your Data
Before tracing which web pages move which deals, you need to know what data you have and where it lives. Most of it already exists across your GTM stack, just in a scattered and messy pattern.
First, start with a digital scavenger hunt:
CRM Data
- Opportunities: type (new, renewal, expansion), stage history, value, owner.
- Accounts & contacts: complete buying groups and relationships between people and deals.
Web Analytics / Marketing Automation
- Page views and session data.
- Form fills, demo requests, gated content.
- UTM tags and referral sources.
Product & Customer Systems
- Login activity, feature engagement, support tickets (all early renewal or expansion signals).
Other Sources
- Calendar invites, meeting notes, email metadata, or call summaries.
Your goal isn’t sophistication yet; it’s visibility. Take the time to really understand what’s there before you begin architecting something new.
2. Bring the Fragmented Data Together
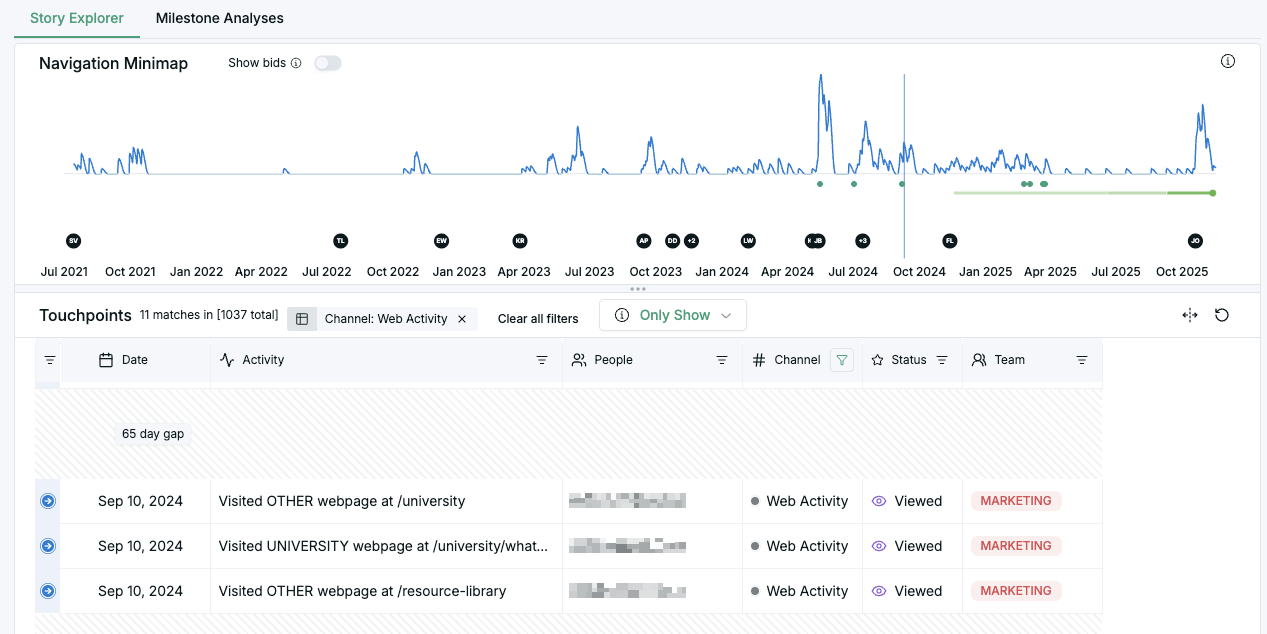
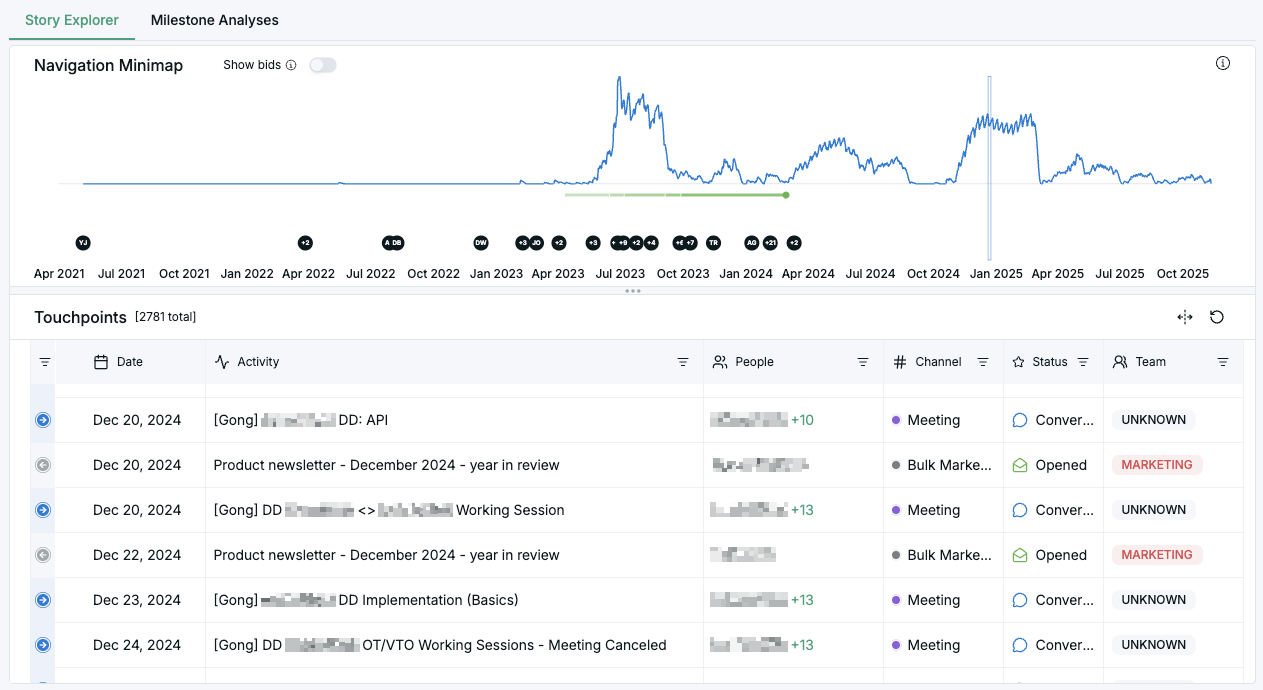
Once you’ve located your data, align it in a single unified view. If you have a data warehouse, query it there; if not, even a spreadsheet can work as a first pass.
Build a chronological record of all page activity tied to known accounts. Include:
- Account name
- Contact (if known)
- Page URL or title
- Page type (blog, docs, pricing, etc.)
- Timestamp
- Associated account
- Associated opportunity (if applicable)
Patterns will start to emerge. Certain blogs appear before the new pipeline opens, while pricing or product update pages precede renewals. This is the first glimpse of a “storyline” that will tell you how web behavior unfolds before revenue outcomes.
3. Annotate and Clean Your Data
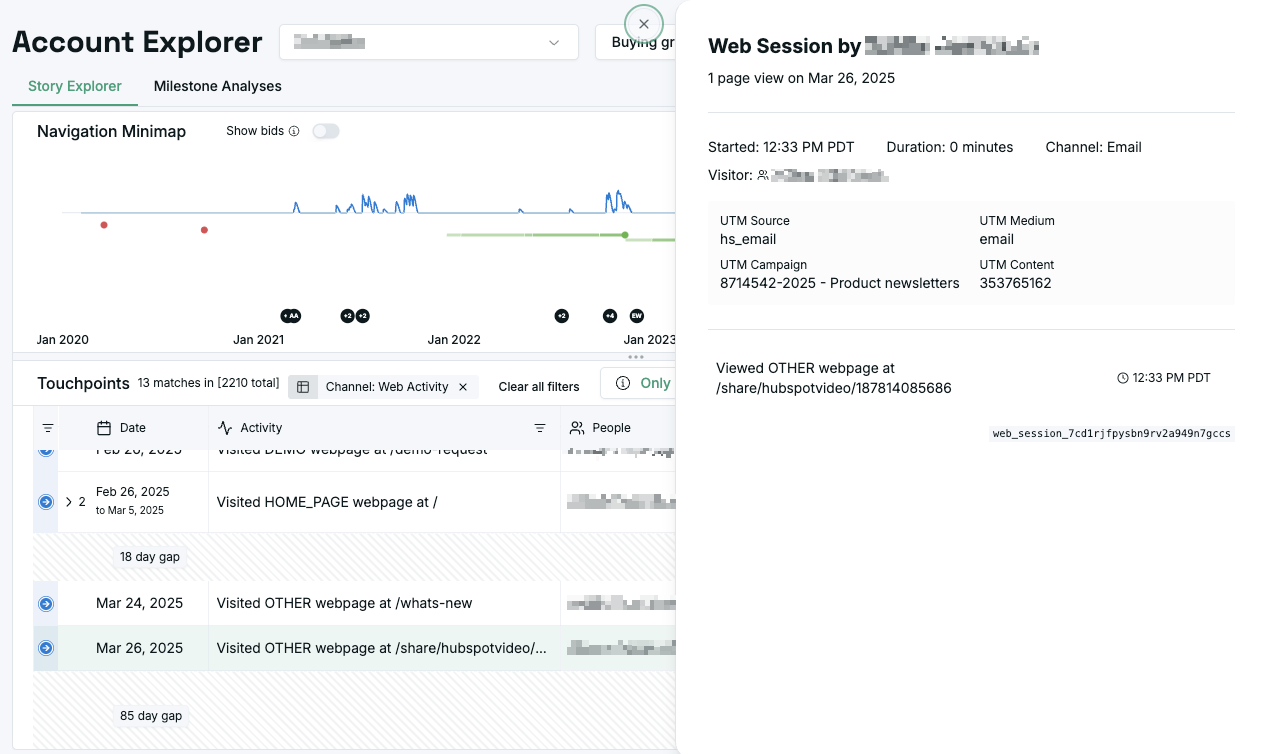
Raw logs alone won’t get you far. For each page activity, make sure you clean up the data so each touchpoint has
- Timestamp: When the visit happened (e.g. 2025-10-12 14:32).
- Individual: Who visited (new prospect, customer, or internal user).
- Context: How they got there (organic search, email click, paid ad).
- Intent: Based on page type. Awareness (blog), evaluation (product page), conversion (pricing).
Cleaning and classifying data is the difference between noise and signal. It’s also the step that breaks most teams because GTM data is notoriously inconsistent, duplicated, and out of sync across systems .
This is why Upside built, and is powered by, a knowledge graph that automatically reconstructs missing or conflicting signals: deduplicating contacts, aligning timestamps, and recovering lost touchpoints from unstructured data.
4. Segment by Opportunity Type
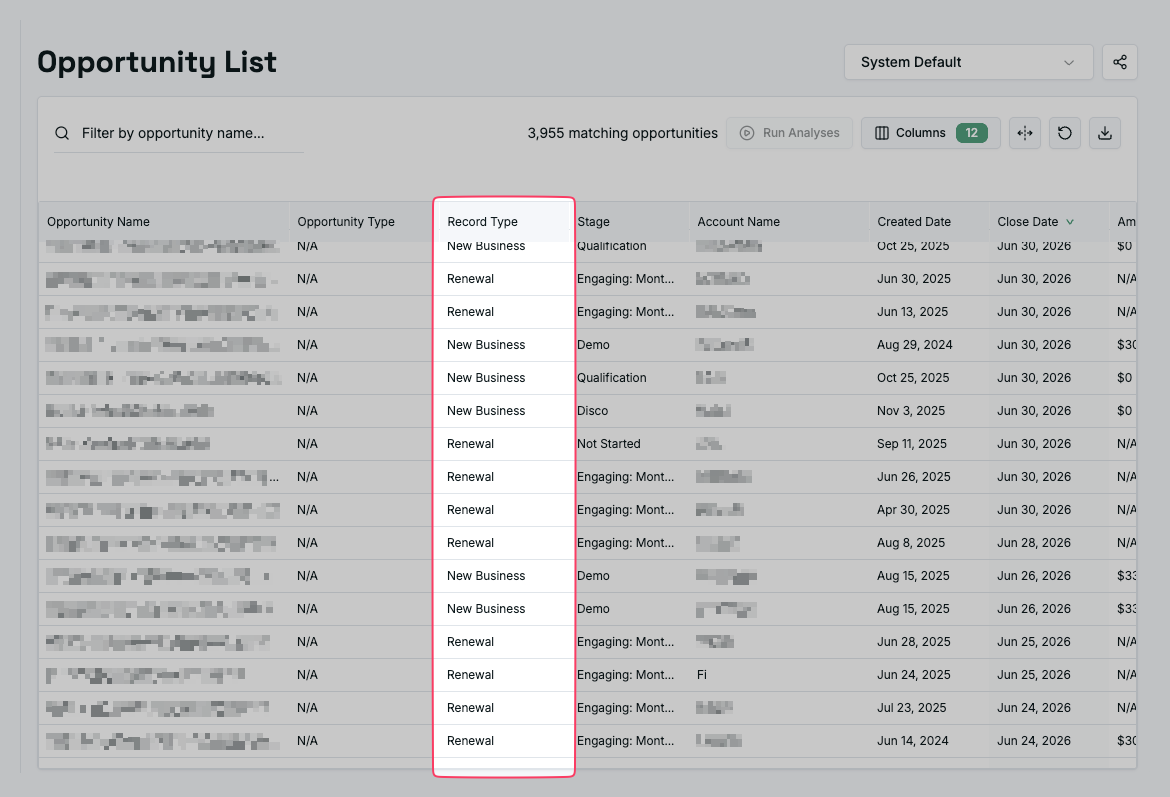
Now, it’s time to connect those page visits to deal outcomes. To do that you can pull CRM opportunity and categorize types into three key buckets:
- Net-new pipeline: new logos, POCs or first-time deals.
- Upsells/expansions: increased ARR or new product lines within existing accounts.
- Renewals: continuation of existing contracts.
Match each web visit to an account and determine with which opportunity it aligns. You might use fields like Opportunity Created Date, Close Date, and Account ID to make the connections.
When done well, this segmentation will give you three mini datasets, each representing a distinct motion in your revenue cycle.
5. Calculate metrics that help you understand web traffic influence on deals
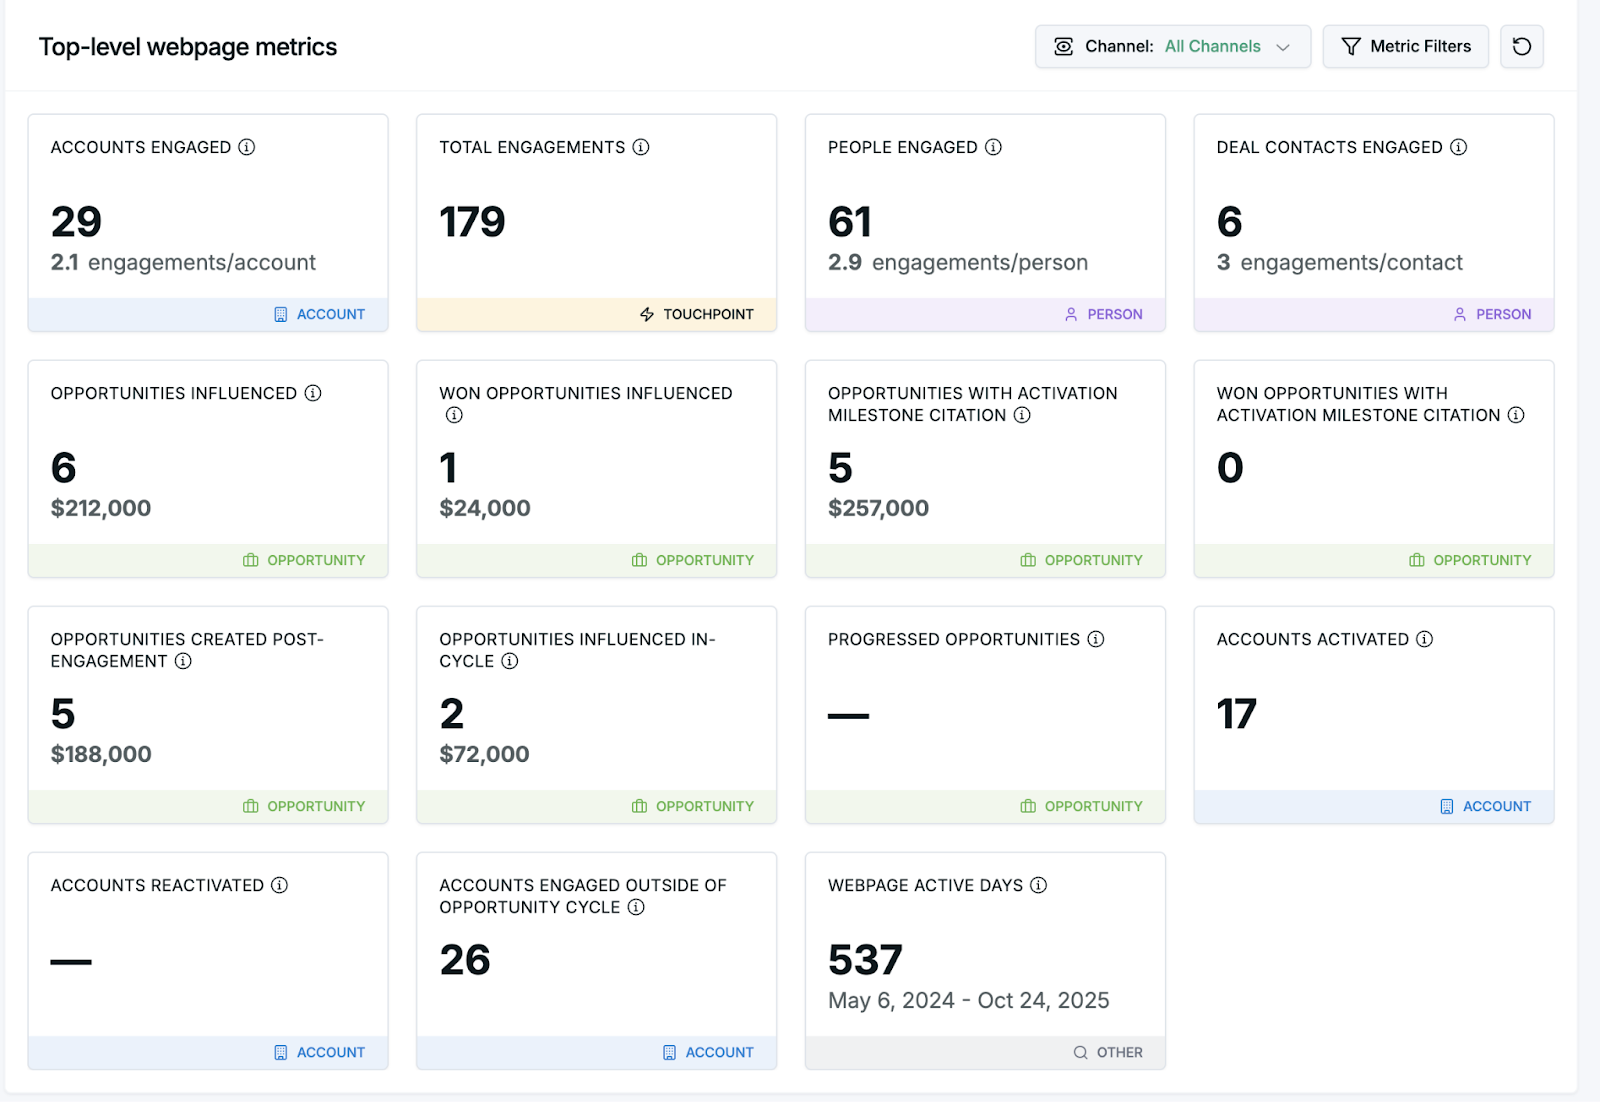
Some of the metrics you should calculate if you have all the data clean and unified in one place include:
Accounts engaged: Count of accounts where any person associated with that account viewed this page.
People engaged: Count of people who viewed this page.
Deal contacts engaged: Count of people who viewed this page and have been in the buying group for any opportunity.
Opportunities influenced: Count and total amount of opportunities where the web page influenced a member of the buying group.
Won opportunities influenced: Count and total amount of won opportunities where a member of the buying group was influenced by the web page.
Opportunities created post-engagement: Count and total amount of opportunities that were created in a specific time window after a member of the buying group viewed the page.
Opportunities influenced in-cycle: Count and total amount of opportunities influenced by this web page during their active cycle.
Progressed opportunities: Count and total amount of opportunities that progressed after page view from at least one buying group member.
Accounts activated: Count of accounts that had no engagement at any time before a person associated with that account viewed this web page.
Accounts reactivated: Count of accounts that had no engagement for 90 days prior to a person associated with that account viewing this web page.
Accounts engaged outside opportunity cycle: Count of accounts where all page views happened while no matching opportunity was open.
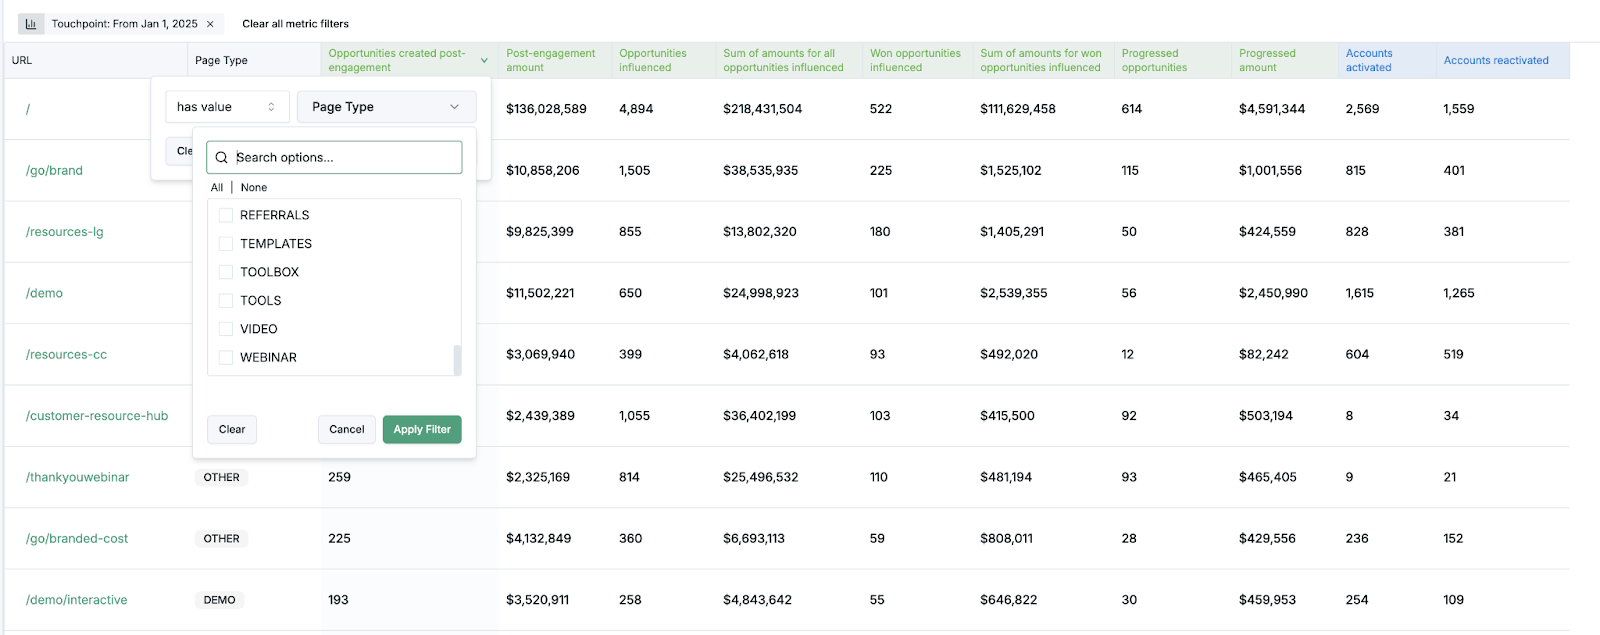
By comparing and contrasting different webpages on the metrics above and filtering by opportunity type, you can start seeing insights and trends. For example:
- Net-new deals might be created after views of specific blog pages, comparison pages, or pricing.
- Upsells might be tied to product updates or feature announcements.
- Successful renewals could be tied to specific educational content.
The Hard Part (and Why It Breaks)
Doing this manually can be hard, which is why most teams just look at visits and sessions instead. An in-house analysis requires:
- Clean buying groups; if the person doing research on the web is missing from the buying group, it’s hard to know what made a difference.
- Identity resolution to unify visits across systems and merge identities of people (the visit from a home computer entering their personal email on a form is the same as the person who has been outbounded by an SDR on their work email).
- Timestamp alignment to reconstruct event order (the campaign upload date is not always the correct date).
That’s why even the most sophisticated RevOps teams struggle to maintain this over time. Every new tool, campaign, or tracking change can break the analysis. You end up with what Upside calls dashboard whiplash: impressive charts that no one trusts.
The Alternative: Forensic Revenue Intelligence with Upside
Upside automates everything above, from buying group detection, to people identity resolution, to tying webpage visits to opportunities and accounts. Our AI agents pull data from your CRM, web analytics, marketing automation, and sales systems — then reconstruct a clean, forensic-level timeline of buyer engagement. The result? Surfacing the patterns that actually drive pipeline, renewals, and upsells, without spreadsheets, SQL scripts, or guesswork.
The Bottom Line
Your website already tells a story — one of discovery, evaluation, and loyalty. The challenge is that most of that story lives hidden across fragmented systems.
When you can see the complete, causal web-to-revenue journey, you stop guessing what works. You can double down on content that truly drives growth, and stop optimizing for clicks that don’t.
Upside makes that visibility automatic, so your team can spend less time cleaning data and more time driving revenue.