A working library of GTM apps.
Each one was built on go-to-market data by describing it to an agent — dashboards, heatmaps, scorers, and analyses. Read the index, open the one that answers your question.
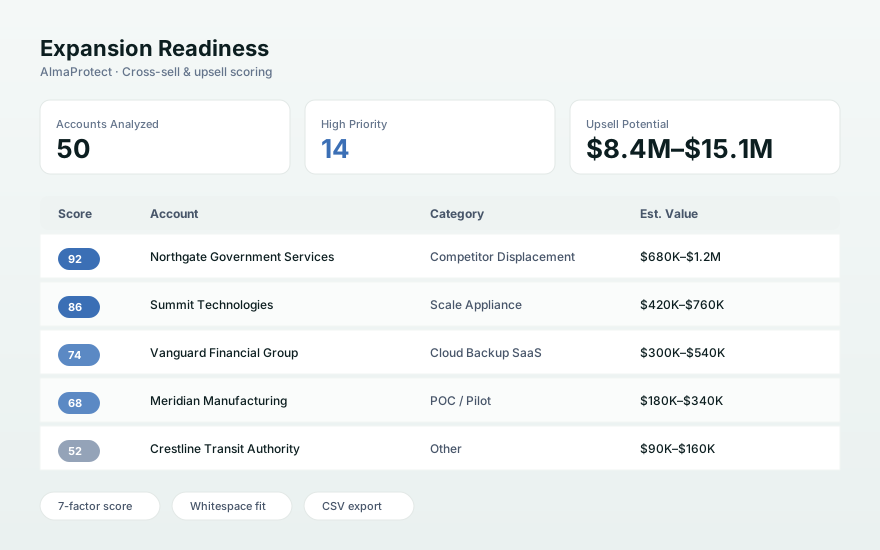
Expansion Readiness
Scores customers on likelihood to expand across seven factors.
View example →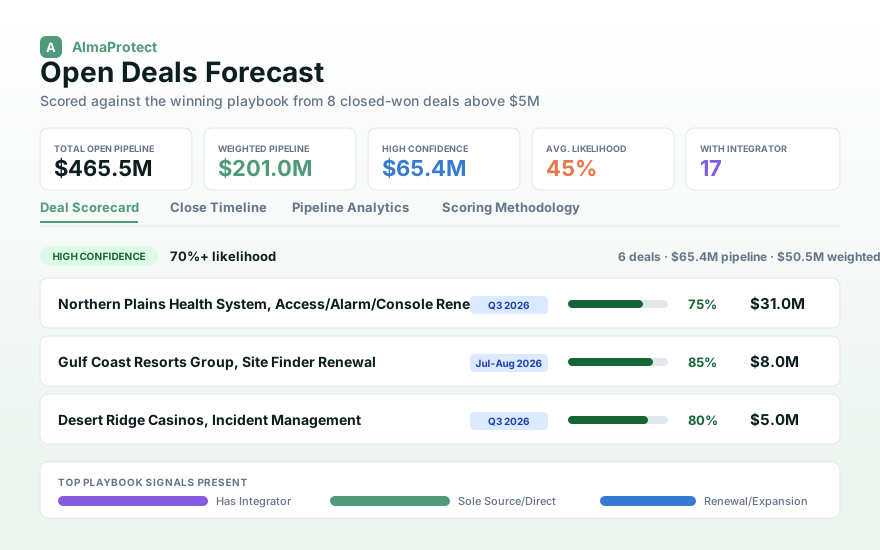
Open Deals Forecast
Every open deal scored — confidence tiers and a close timeline.
View example →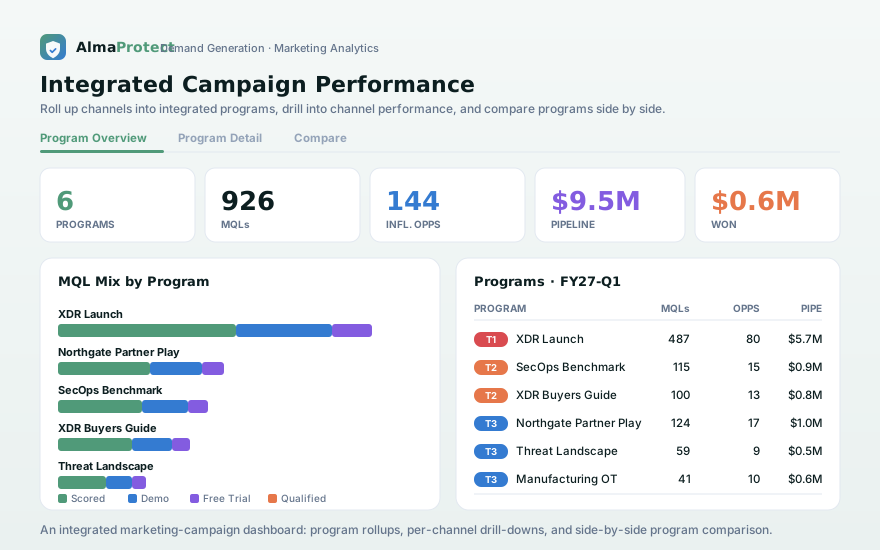
Integrated Campaign Performance
Every program from members to closed-won, with side-by-side compare.
View example →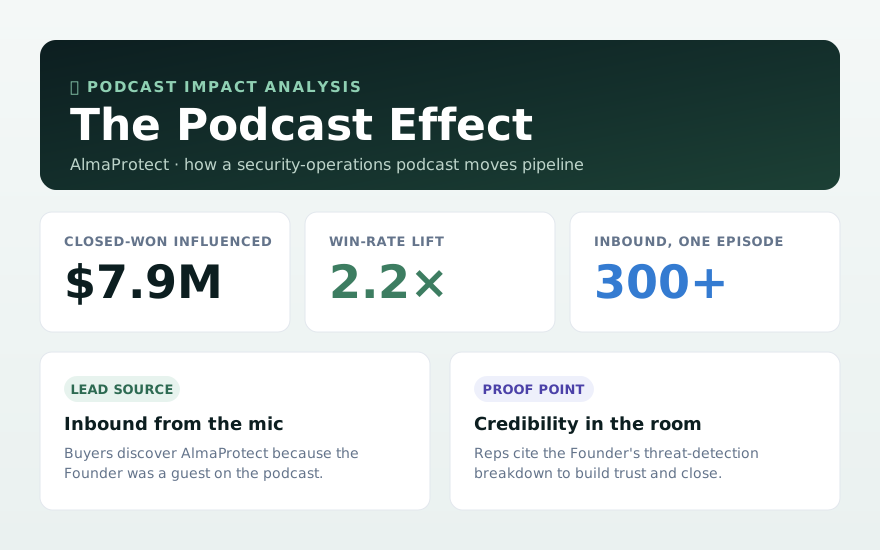
The Podcast Effect
How a founder's podcast appearances move pipeline, as source and proof point.
View example →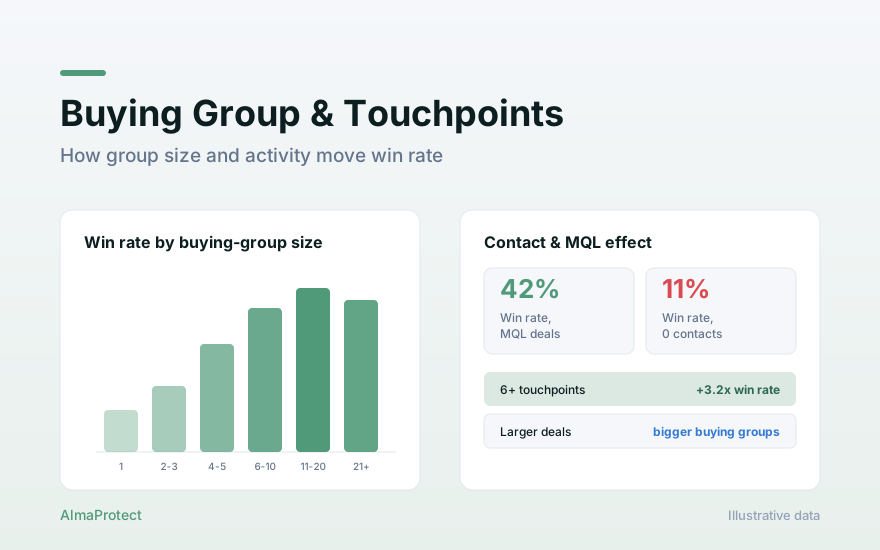
Buying Group & Touchpoints Explorer
How group size, touchpoints and MQL status relate to win rate.
View example →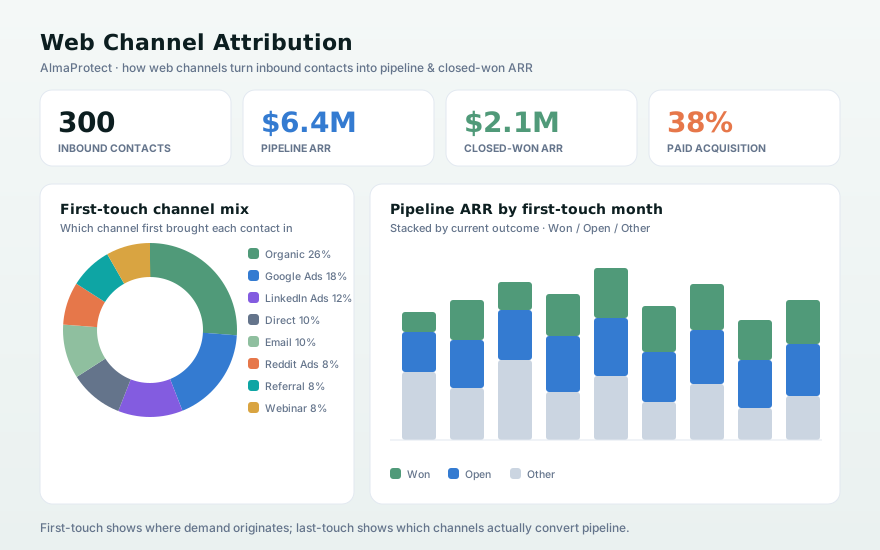
Web Channel Attribution
Every inbound traced from first-touch web channel to the last touch.
View example →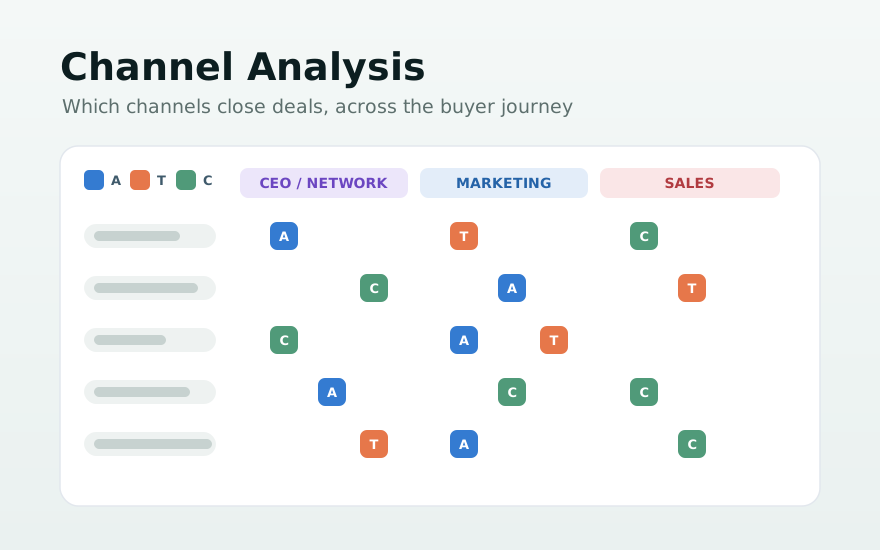
Channel Analysis
Which channels influenced closed-won, across the full buyer journey.
View example →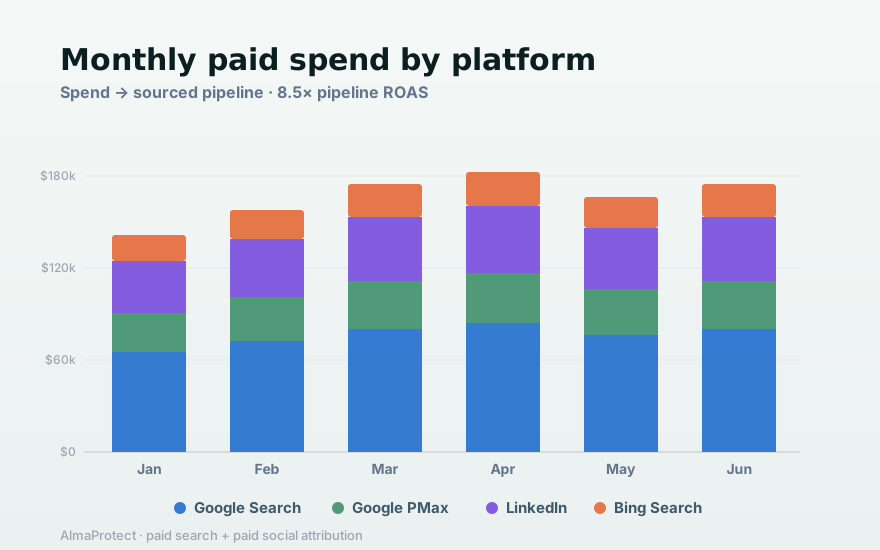
Paid Media Impact
How paid search and social turn spend into influenced pipeline.
View example →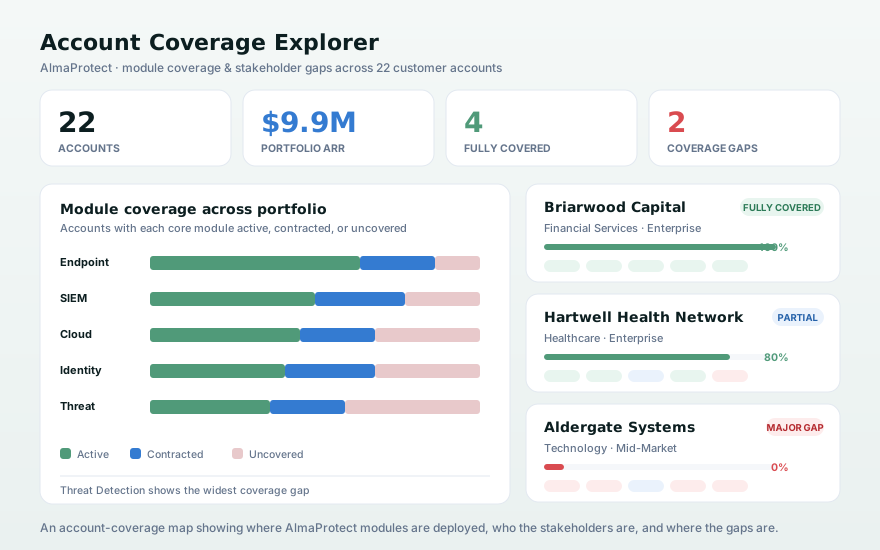
Account Coverage Explorer
Which modules are contracted vs used — coverage that spots whitespace.
View example →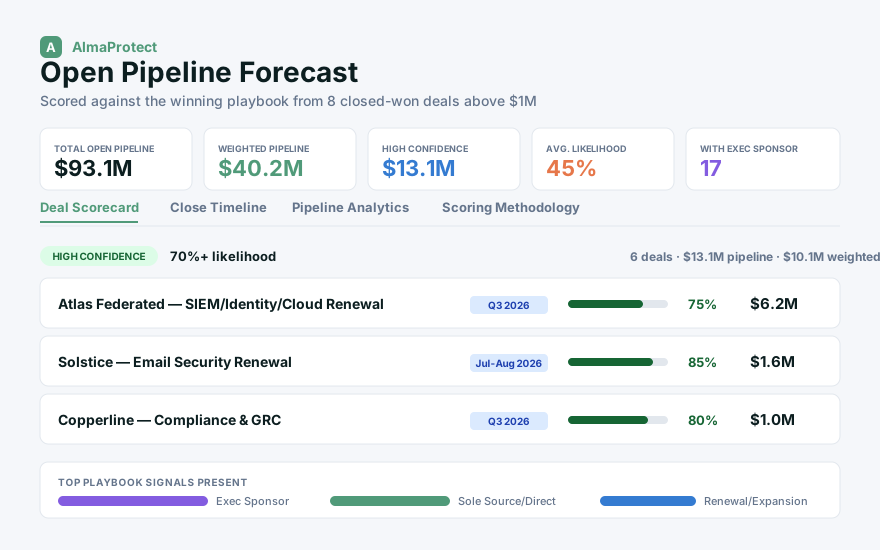
Pipeline Forecast
Scores open opps against the winning profile for a weighted forecast.
View example →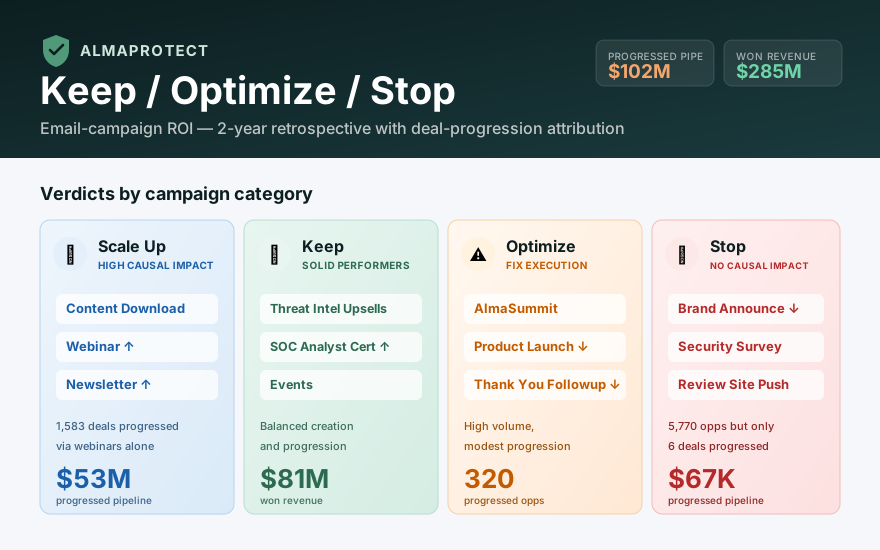
Keep / Optimize / Stop
Grades campaigns on whether a touch actually moved a deal forward.
View example →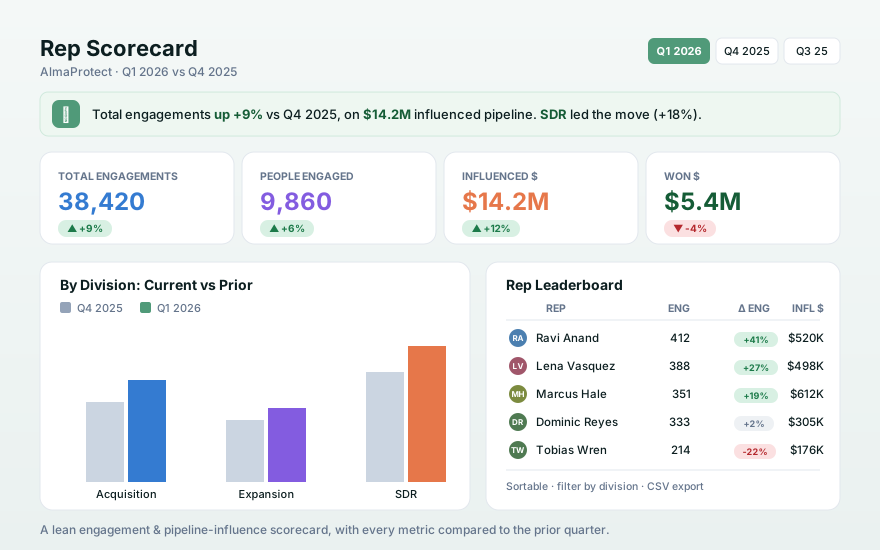
Rep Scorecard
Engagement and opportunity-influence metrics, by division and rep.
View example →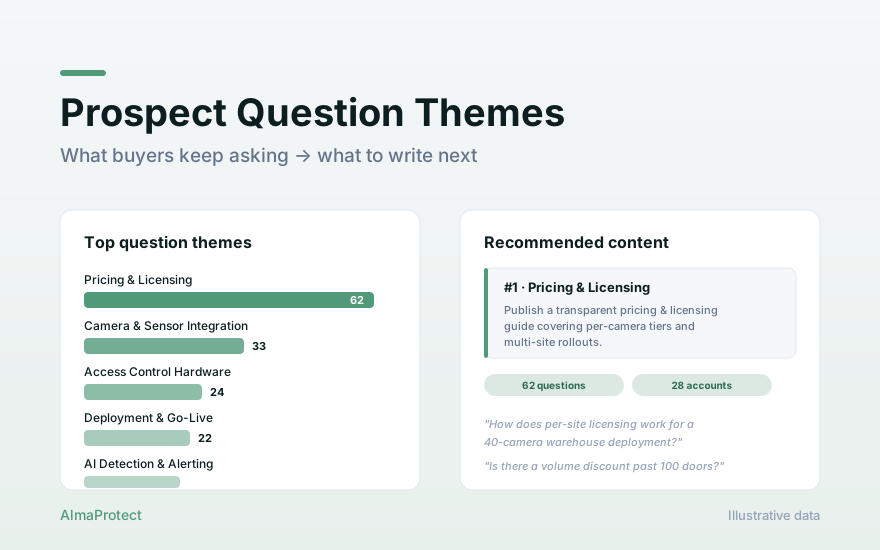
Prospect Question Themes
Clusters prospect questions into themes, ranks content ideas by demand.
View example →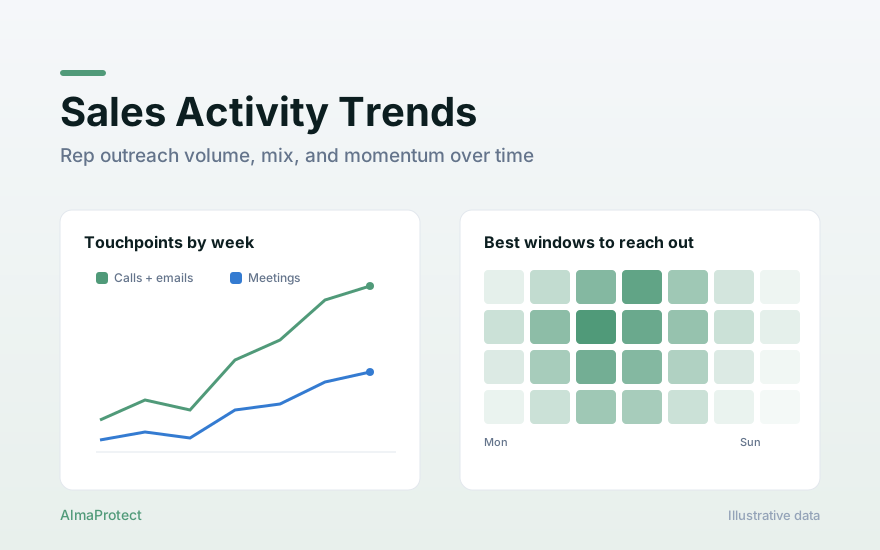
Sales Activity Trends
Calls, emails and meetings over time, with an activity heatmap.
View example →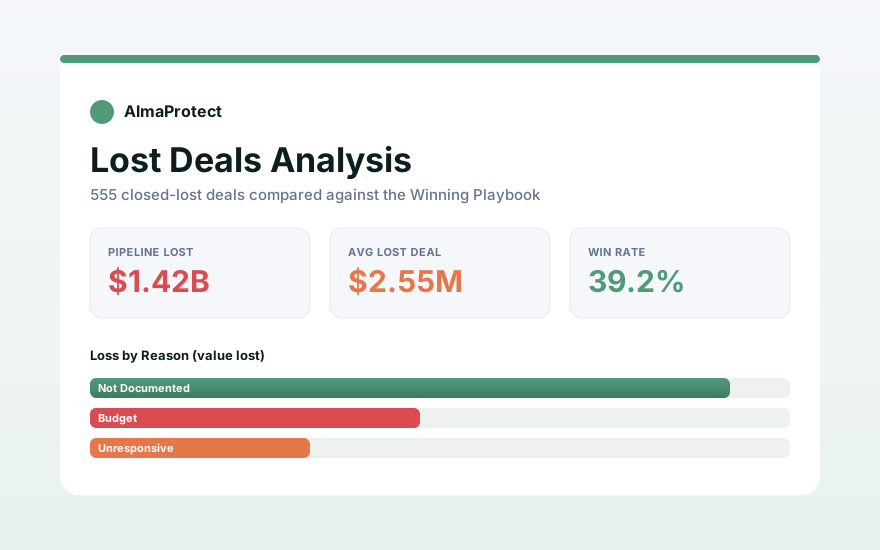
Lost Deals Analysis
Every closed-lost deal read against the winning playbook.
View example →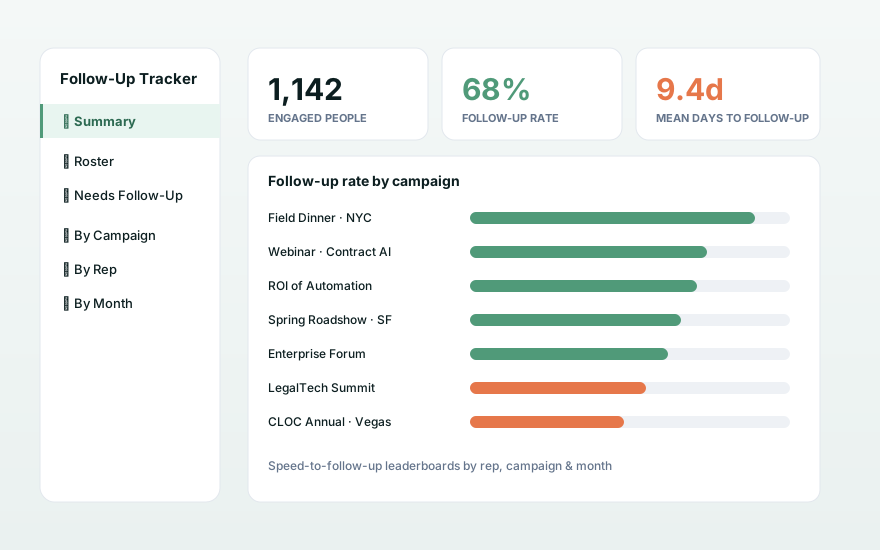
Campaign Follow-Up Tracker
After a campaign engagement, how fast does sales follow up — and who's waiting?
View example →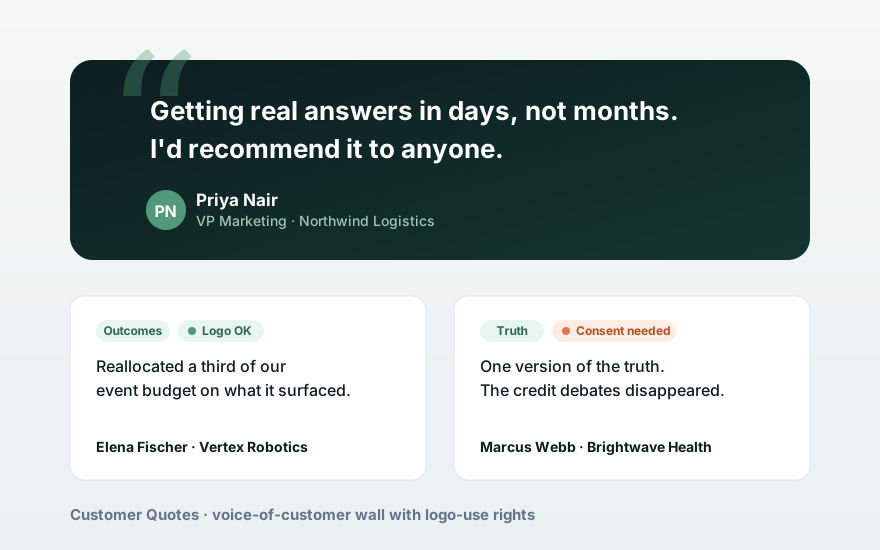
Customer Quotes
A voice-of-customer wall from call transcripts, with logo rights.
View example →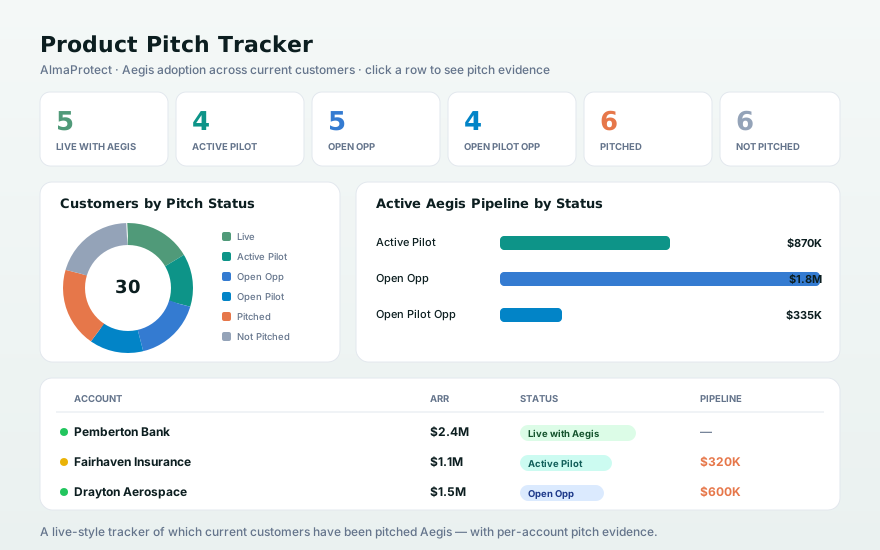
Product Pitch Tracker
Which accounts were pitched the flagship, across an adoption funnel.
View example →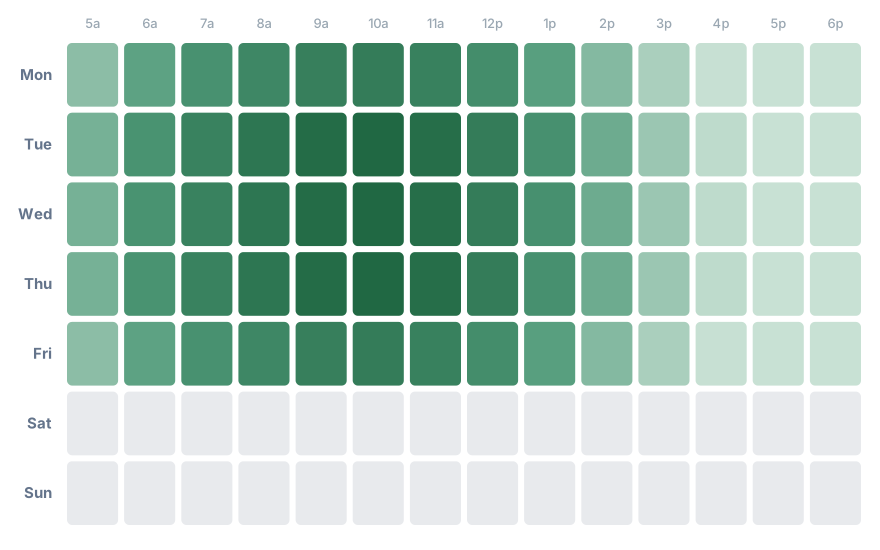
Send Time Optimizer
The day-and-hour windows where outbound earns the most replies.
View example →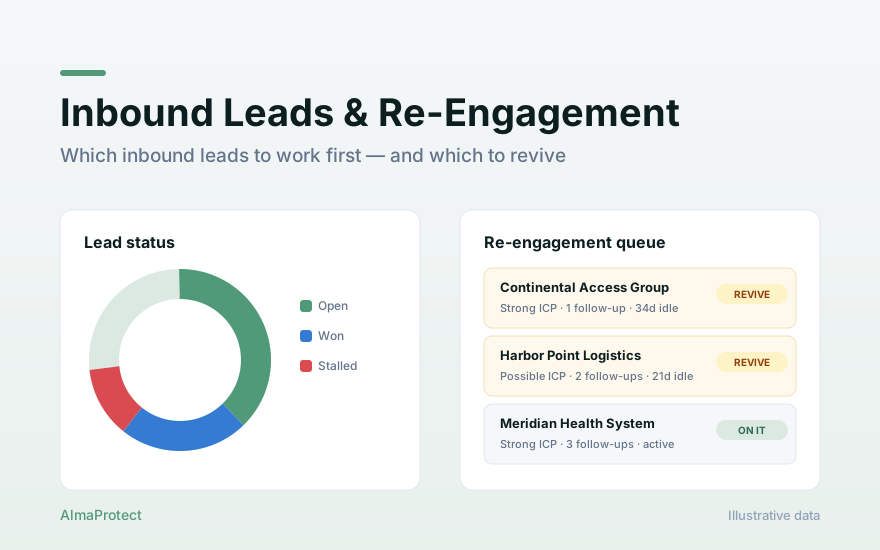
Inbound Leads & Re-Engagement Explorer
Every inbound lead by status, source and ICP fit — plus a revive queue.
View example →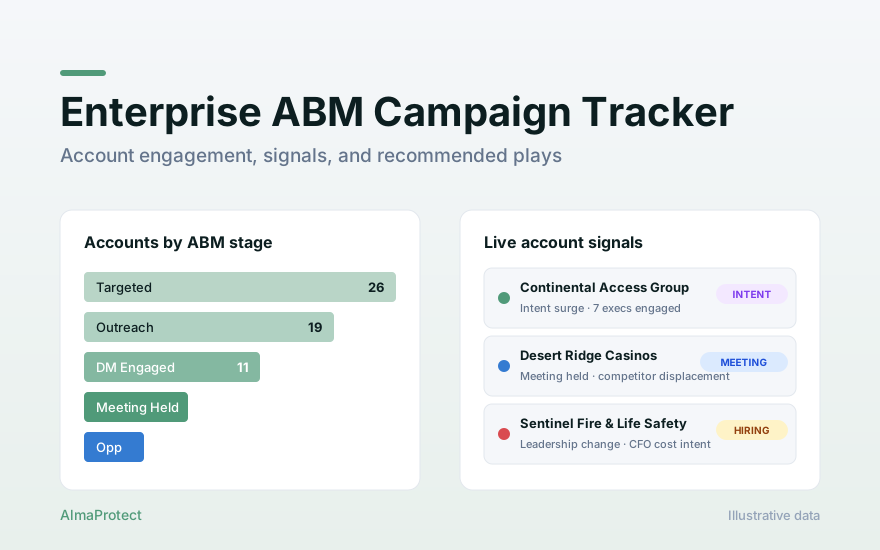
Enterprise ABM Campaign Tracker
Target accounts through the ABM funnel, fused with buying signals.
View example →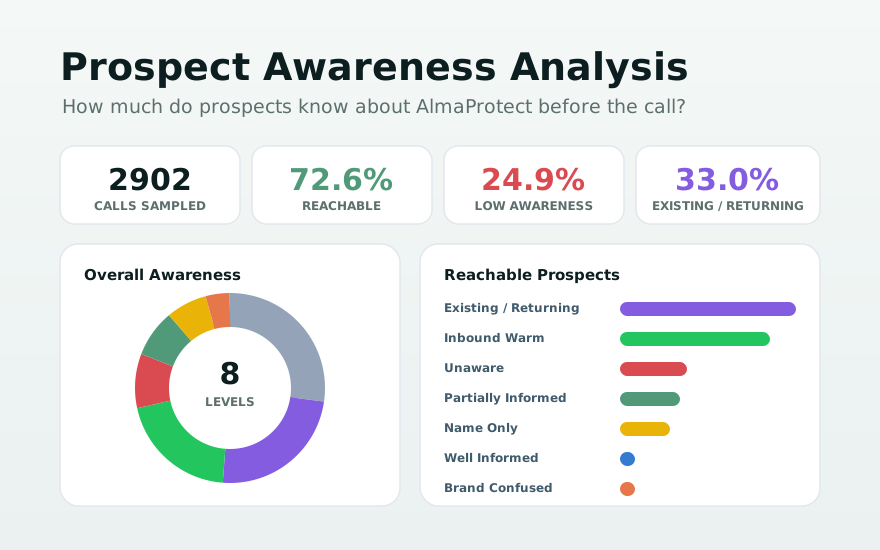
Prospect Awareness Analysis
How much each prospect already knows before the SDR call.
View example →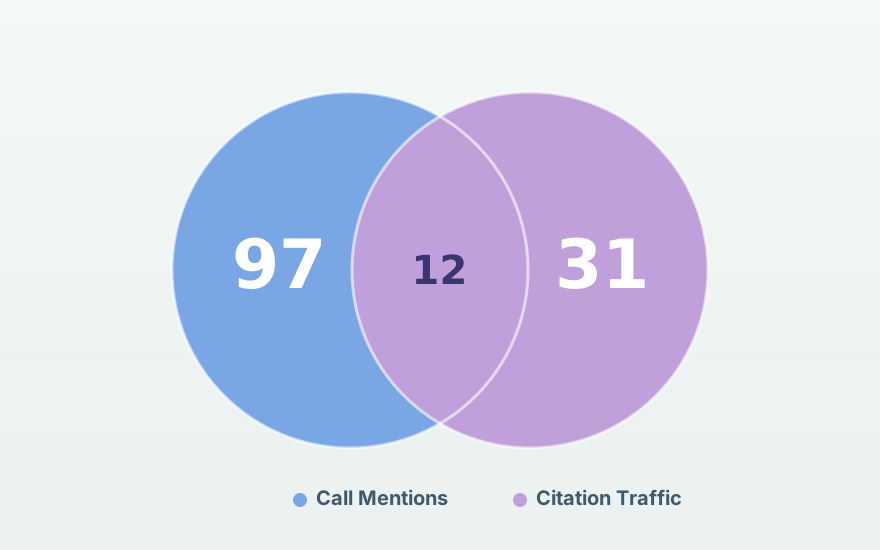
AEO Influence Analysis
How AI engines move pipeline — citation traffic, call mentions and win-rate lift.
View example →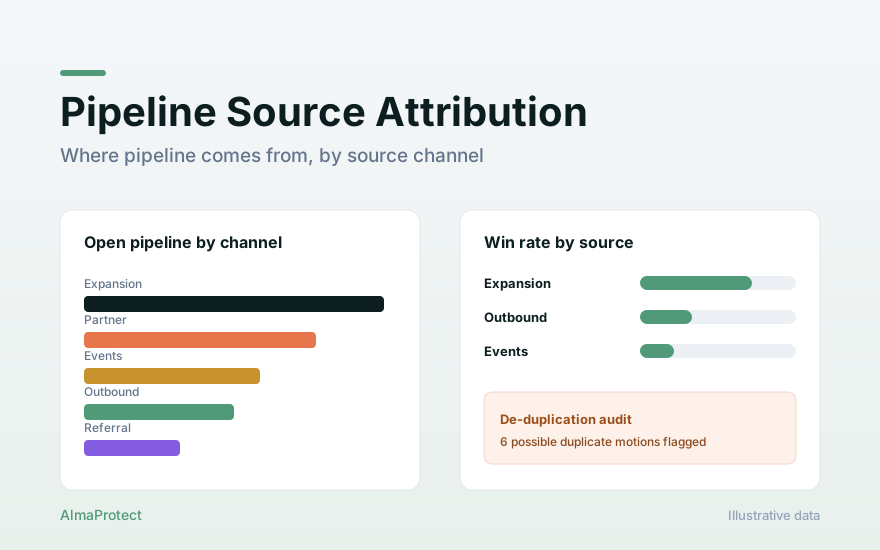
Pipeline Source Attribution
Where pipeline really comes from, on a de-duplicated account rollup.
View example →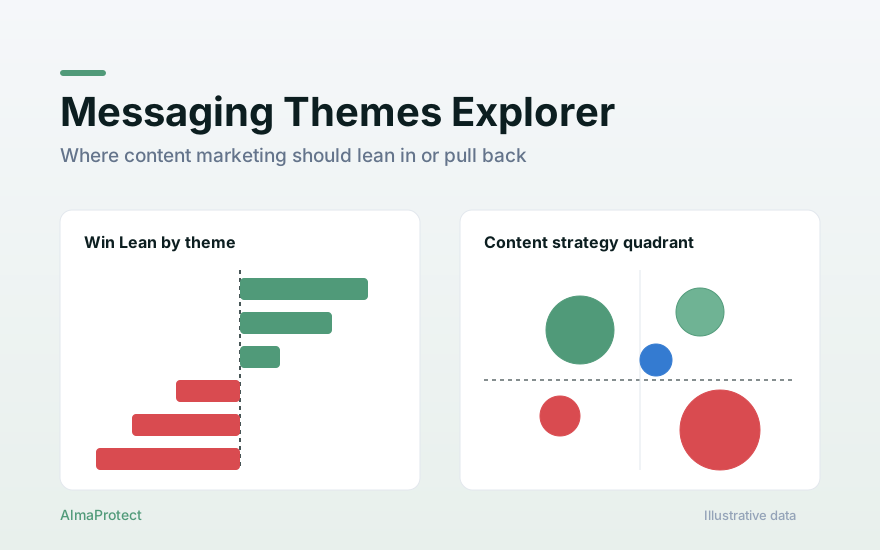
Messaging Themes Explorer
The words that win vs the ones that stall, mined from calls.
View example →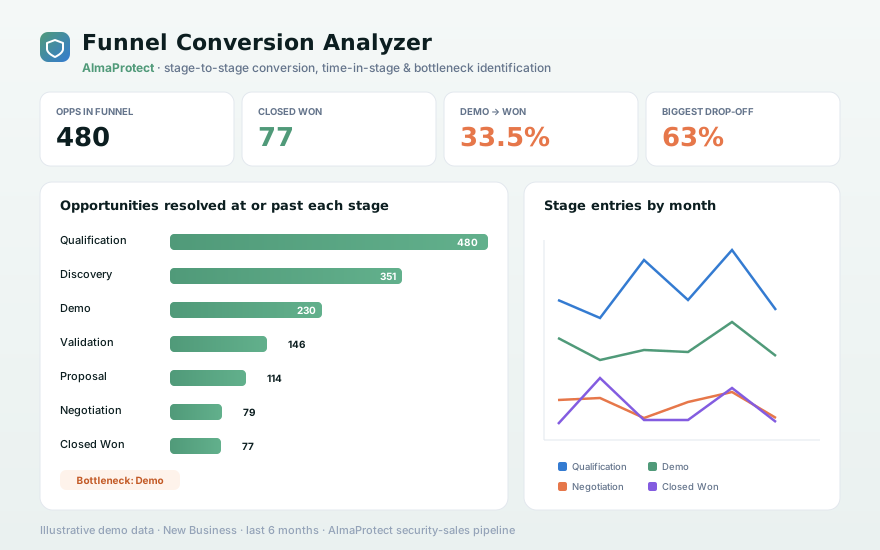
Funnel Conversion Analyzer
A resolved-or-past funnel that flags the real bottleneck.
View example →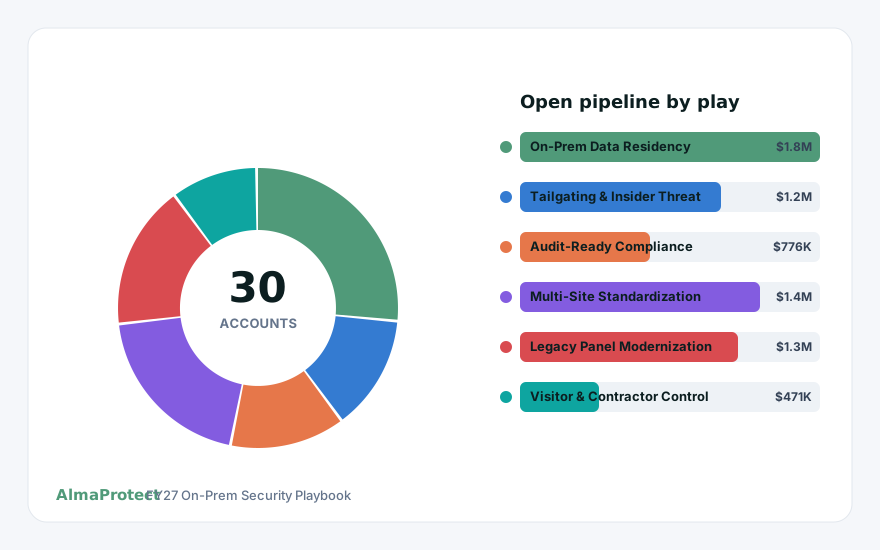
Sales Play Identifier
Scores every account against the playbook: which play fits, and why.
View example →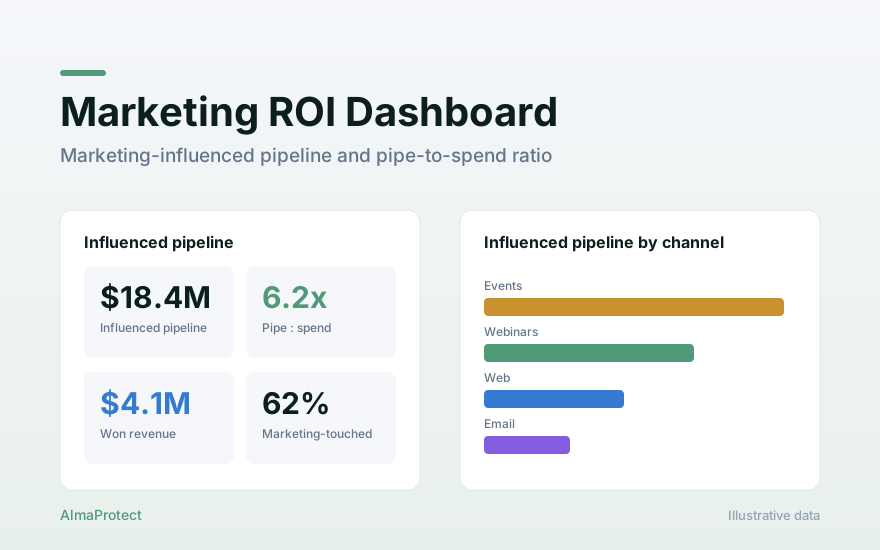
Marketing ROI Dashboard
Board-level influenced pipeline and the pipe-to-spend ratio.
View example →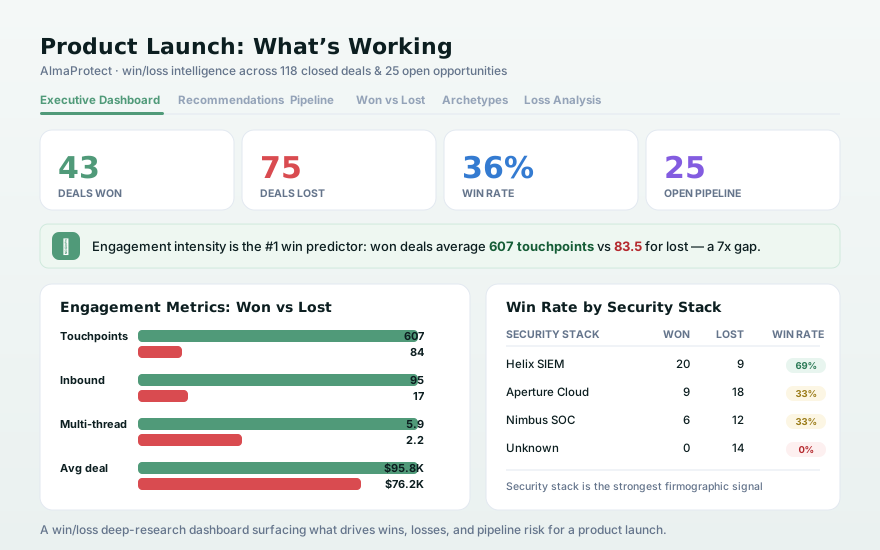
Product Launch: What's Working
A win/loss deep-dive on a launch — benchmarks, loss patterns, risk.
View example →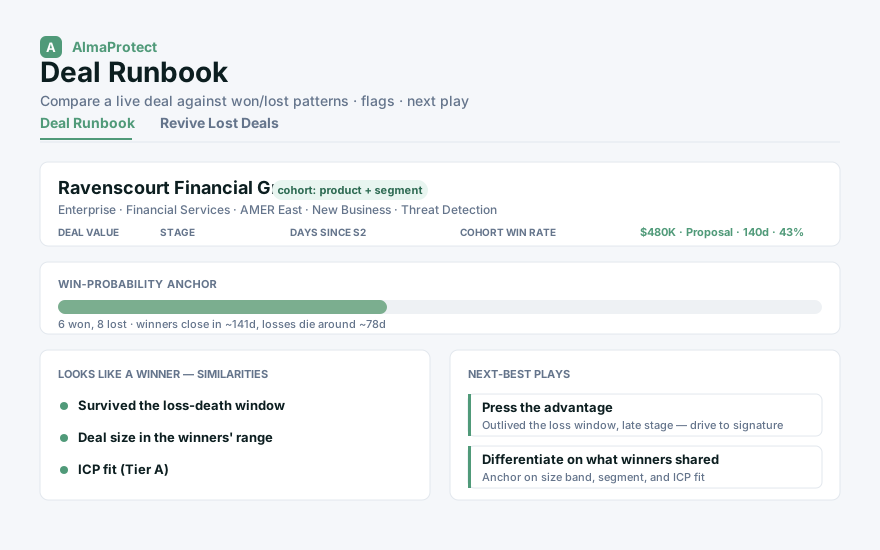
Deal Runbook
Matches a live deal to its closest cohort and writes the next play.
View example →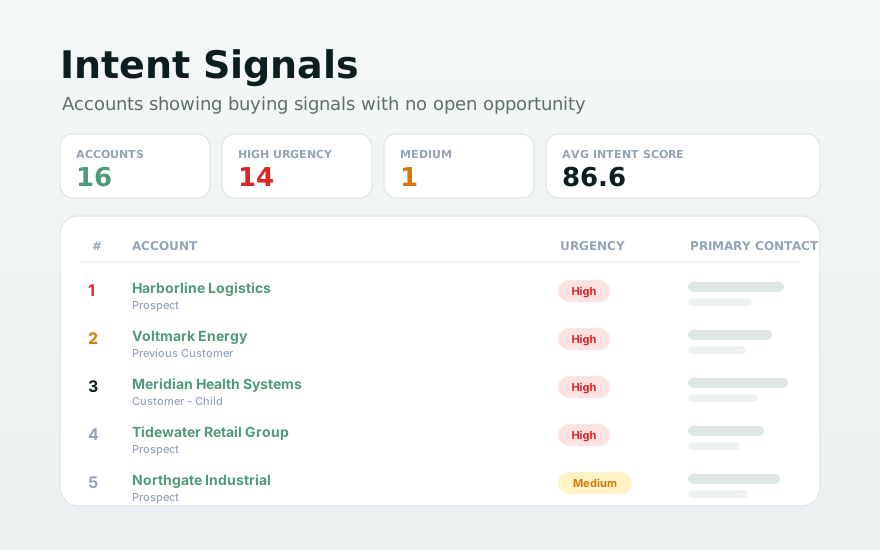
Intent Signals
Accounts showing buying signals with no open opp, ranked by intent.
View example →From a sentence to a shipped app.
Describe it
Tell Claude, Cursor, or Upside's hosted agent the tool you need — in plain language, no spec required.
Built on your data
The app is generated against your healed, identity-resolved GTM data. The hard data work is already done.
Publish to the team
Ship it inside Upside with independent view and edit scopes. No BI backlog, no shadow IT.
Build your own, on your own numbers.
Connect your go-to-market data and turn a prompt into an app like these — live for the whole team.
Request a demo